======================================================================= Cybernetics in the 3rd Millennium (C3M) Volume 16 Number 1, Dec. 2022 Alan B. Scrivener — www.well.com/user/abs — mailto:abs@well.com ======================================================================== In this issue: at the risk of over-explaining a joke, this screencap is from the HBO TV series "Game of Thrones" (2011-2019) — the character was known as Daenerys Stormborn of House Targaryen, the First of Her Name, Queen of the Andals and the First Men, Protector of the Seven Kingdoms, the Mother of Dragons, the Khaleesi of the Great Grass Sea, the Unburnt, the Breaker of Chains — at her peak she was the most powerful and feared character on the show — in this scene she is weak, vulnerable and full of doubt ( internet meme )
- Short Subjects
- A Curriculum for Cybernetics and Systems Theory Version 2.0
- I Finally Got a Machine Learning Program To Learn Something
- If It's Just a Virtual Actor, Then Why Am I Feeling Real Emotions? (Part Eight)
Short Subjects
"Fractured Flickers" letterhead with Theda Bara (artofjayward.blogspot.com/2015/06/fractured-flickers.html)
- Reviews in "A Curriculum for Cybernetics Version 2.0"
 My revised curriculum (introduced below) has 70 books, 9
videos and 6 papers listed, along with software, games, web pages and whatnot.
I won't repeat them here. Next are some other things.
My revised curriculum (introduced below) has 70 books, 9
videos and 6 papers listed, along with software, games, web pages and whatnot.
I won't repeat them here. Next are some other things.
- Updated Spruce Budworm Dynamics Visualization I described Dr. Alan Garfinkel's analysis of the dynamics of spruce budworm infestations in C3M v15n1 and also shared a visualization I did using Web3D tools. I have since updated the visualization with better interactivity and more details where they matter. (It may take a long time to load; be patient.)
- Book reviews:
- Skin In the Game: Hidden Asymmetries in Daily Life (2099) by Nicholas Taleb
ISBN: 0425284646
 Taleb has a wonderful knack for making clarifying distinctions (or, as Tony
Robbins says, "empowering distinctions," since clarity leads to power).
The concepts of "black swan" and "antifragile" (from the books of the same
name) are two, and another is "skin in the game."
Early in the book he mentions the 3,800-year-old Babylonian law called the
Code of Hammurabi, which includes a provision that if a building collapses and
kills someone, the builder should be put to death. He contrasts this with
modern banking, in which government guarantees protect bankers from the
downsides of their decisions, while bonuses reward the upsides.
I remember hearing the term "skin in the game." in high school football, and I
assumed it came from actually scraping off some skin accidentally while playing
and leaving it on the field. It turns out it comes from a variation on golf
called skins golf, which I don't really get. But no matter.
Taleb scours society and its history to find and relate situations where the
influence of people without skin in the game has lead to war, financial
disaster, fraud, and all-around bad juju. Good stuff.
Taleb has a wonderful knack for making clarifying distinctions (or, as Tony
Robbins says, "empowering distinctions," since clarity leads to power).
The concepts of "black swan" and "antifragile" (from the books of the same
name) are two, and another is "skin in the game."
Early in the book he mentions the 3,800-year-old Babylonian law called the
Code of Hammurabi, which includes a provision that if a building collapses and
kills someone, the builder should be put to death. He contrasts this with
modern banking, in which government guarantees protect bankers from the
downsides of their decisions, while bonuses reward the upsides.
I remember hearing the term "skin in the game." in high school football, and I
assumed it came from actually scraping off some skin accidentally while playing
and leaving it on the field. It turns out it comes from a variation on golf
called skins golf, which I don't really get. But no matter.
Taleb scours society and its history to find and relate situations where the
influence of people without skin in the game has lead to war, financial
disaster, fraud, and all-around bad juju. Good stuff.
- Megastructure: Urban Futures of the Recent Past (1976) by Reyner Banham
ISBN: 0064303713
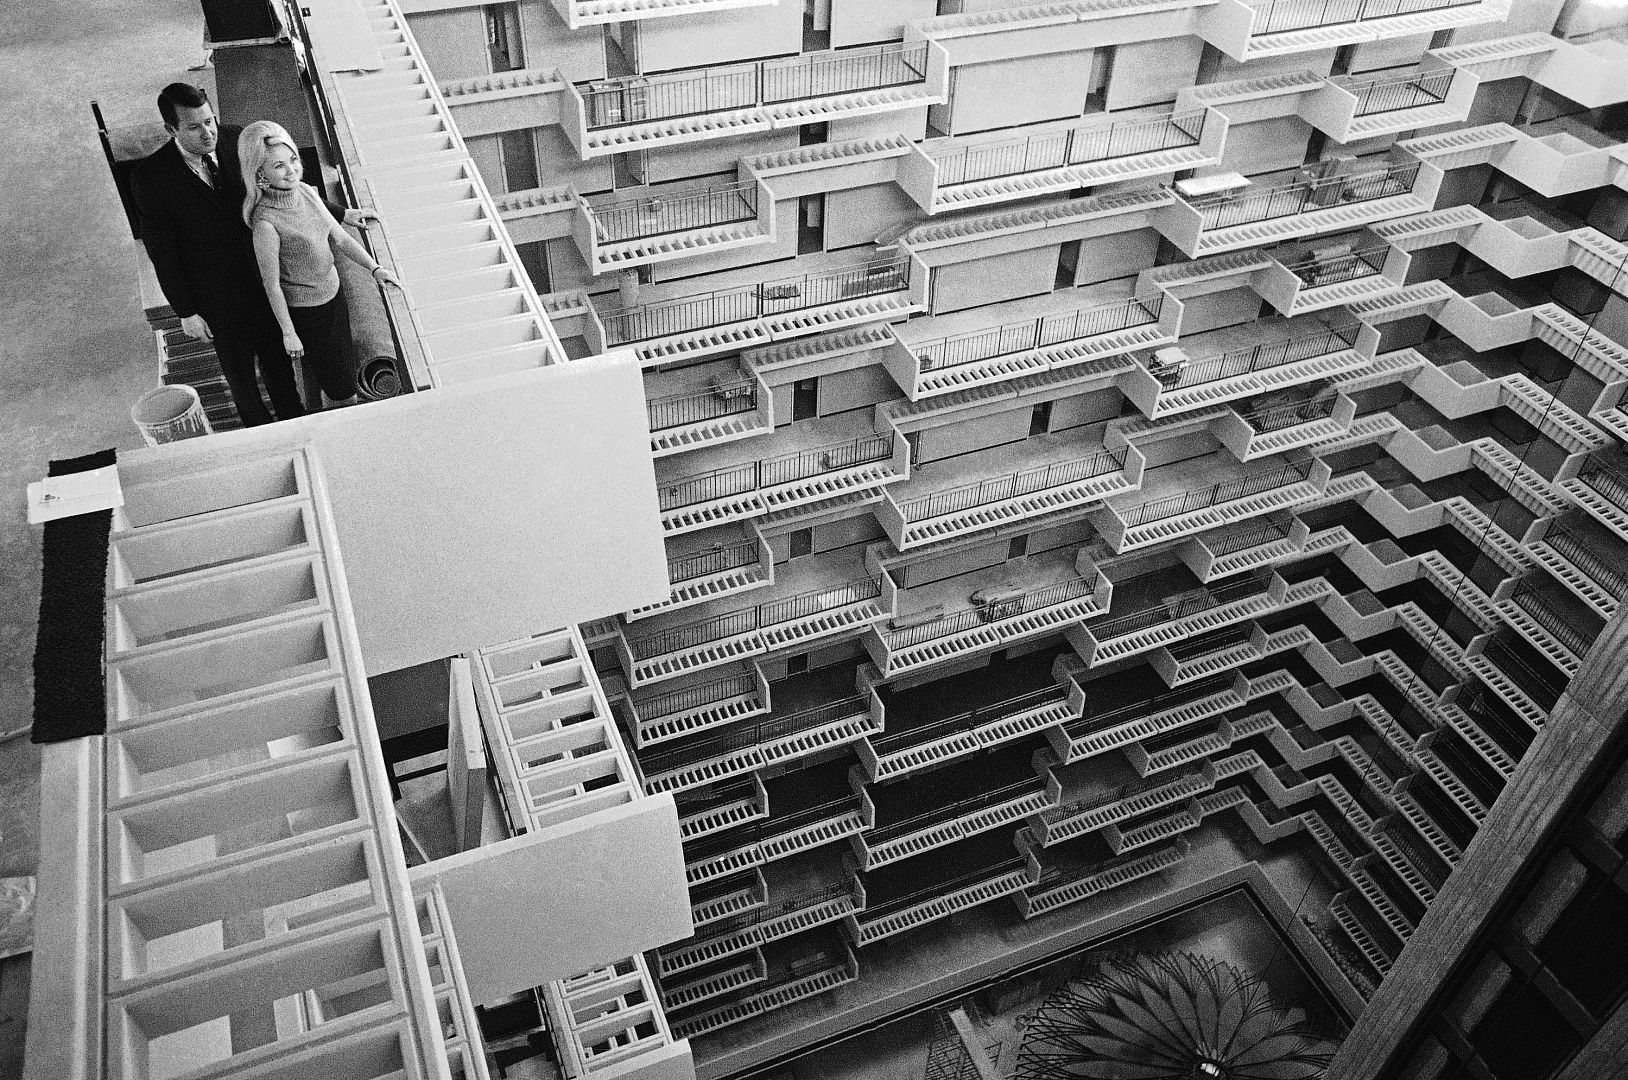 I originally wanted to write about how I have great respect for author Reyner
Banham because of his book "Los Angeles: The Architecture of Four Ecologies"
(1971), especially his ideas about layers of Los Angels history, and that's
a big reason I read this book, which describes a paradoxical architectural fad
that came and went quickly, and yet would've required generational consistency
to come to fruition. I wanted to explore the relationship between the ideas of
megastructure architecture and the vision of homo ludens, the playing
[hu]man, and connections to the Arcologies of Paolo Soleri, the floating cities
of Bucky Fuller, and the Contemporary Hotel at Walt Disney World, as well as
relevance to the designs for space colonies. But there's no time for all that
now, so I'll cut to the chase.
For reasons that are up for debate (perhaps related to the personality types
drawn to a theory of control?), this "megastructure" idea attracted two
luminaries in cybernetics and systems theory:
I originally wanted to write about how I have great respect for author Reyner
Banham because of his book "Los Angeles: The Architecture of Four Ecologies"
(1971), especially his ideas about layers of Los Angels history, and that's
a big reason I read this book, which describes a paradoxical architectural fad
that came and went quickly, and yet would've required generational consistency
to come to fruition. I wanted to explore the relationship between the ideas of
megastructure architecture and the vision of homo ludens, the playing
[hu]man, and connections to the Arcologies of Paolo Soleri, the floating cities
of Bucky Fuller, and the Contemporary Hotel at Walt Disney World, as well as
relevance to the designs for space colonies. But there's no time for all that
now, so I'll cut to the chase.
For reasons that are up for debate (perhaps related to the personality types
drawn to a theory of control?), this "megastructure" idea attracted two
luminaries in cybernetics and systems theory:
- George Dantzig, creator of the simplex method in linear programming, who with T. L. Saaty wrote a book called Compact City: A Plan for a Liveable Urban Environment (1973) ISBN: 0716707845, about a proposed solution to sprawl, involving shrinking the footprint of a city and reducing automobile traffic [p. 211]
- Gordon Pask, cybernetician and author of An Approach to
Cybernetics (1961) ASIN: B0000CL763, who collaborated with Cedric Price and
others on the idea of the Fun Palace, a reconfigurable space for some
unspecified fun. [p. 215]
Barham adds:
The answer to Denise Scott-Brown's 1968 question, both rhetorical and satirical, 'What is everybody doing up there with everybody else in those megastructures?' might prove, only half satirically, to be, rearranging the equipment for the next game!
I would also add that when I was at Kresge College at the University of California at Santa Cruz (an early example of postmodern architecture, sometimes called "Clown Town" by students), our town hall, nicknamed the "Clown Hall," had reconfigurable structures of pipes, clamps and pressboard, with which we could build stages, platforms and whatnot, and we had a lot of fun with them.
- Skin In the Game: Hidden Asymmetries in Daily Life (2099) by Nicholas Taleb
ISBN: 0425284646
- Video reviews:
- 3Blue1Brown's Summer of Math Exposition
In the summer of 2021 Grant Sanderson's math explainer channel 3Blue1Brown
had a contest to get more people making math explainer videos. I submitted
an entry on 21 Aug 2021:
* Figuring Odds for Gamblers with Alan Scrivener
 ( www.youtube.com/watch?v=9VtUGePcI20 )
Below are links for other entries and winners (I did not place):
* SoME1 results Oct 22, 2021 by 3Brown1Blue
( www.3blue1brown.com/blog/some1-results )
* A few of the best math explainers from this summer Oct 23, 2021
( www.youtube.com/watch?v=F3Qixy-r_rQ )
* Summer of Math Exposition Youtube Videos Nov 8, 2021
( www.youtube.com/playlist?list=PLnQX-jgAF5pTkwtUuVpqS5tuWmJ-6ZM-Z )
Everything by 3Blue1Brown is excellent.
( www.youtube.com/watch?v=9VtUGePcI20 )
Below are links for other entries and winners (I did not place):
* SoME1 results Oct 22, 2021 by 3Brown1Blue
( www.3blue1brown.com/blog/some1-results )
* A few of the best math explainers from this summer Oct 23, 2021
( www.youtube.com/watch?v=F3Qixy-r_rQ )
* Summer of Math Exposition Youtube Videos Nov 8, 2021
( www.youtube.com/playlist?list=PLnQX-jgAF5pTkwtUuVpqS5tuWmJ-6ZM-Z )
Everything by 3Blue1Brown is excellent.
- Math Has a Fatal Flaw (2020) by Veritasium A mind-blowing look at Godel's Theorem, the proof that broke math. ( www.youtube.com/watch?v=HeQX2HjkcNo ) Other Vertasium videos (all excellent): ( www.youtube.com/c/veritasium/videos )
- Online resources for first- and second-year STEM courses These resources will have you covered during those last-minute crunch sessions By Tahmeed Shafiq 2021
- failure videos
In the Traveling Techie Blog for Friday 18 November 2016, "FAILURE ANALYSIS,"
I talked about the taboo against examining failures, despite the obvious
usefulness of knowing what went wrong. This is the spirit behind a recent
video obsession of mine, looking at aircraft crash forensics, and why ancient
civilizations collapsed:
- Mayday Air Disasters
- Wonder Air Disasters
- Fall of Civilizations TV
- We Are As Gods
Stewart Brand biography
This film is finished and has been shown publicly, but is not available online
or in theaters right now. I guess it needs more demand.
WE ARE AS GODS offers a deep dive into the many sides of Stewart Brand–creator of The Whole Earth Catalog, an influential member of Ken Kesey's "The Merry Pranksters," and founder of the modern environmental movement. Brand's approach to his work and life influenced many, including Steve Jobs, who have gone on to shape our modern world. Now in his 80's, he looks to leave a legacy for the long-term future with his efforts to resurrect ecosystems through de-extinction. The man who coined the phrase "we are as gods and might as well get good at it" is now under fire from former allies who believe he's gone too far, but Brand won't be easily deterred from a mission he feels is necessary to save the future of the planet.
- — Synopsis from web site
- 3Blue1Brown's Summer of Math Exposition
In the summer of 2021 Grant Sanderson's math explainer channel 3Blue1Brown
had a contest to get more people making math explainer videos. I submitted
an entry on 21 Aug 2021:
* Figuring Odds for Gamblers with Alan Scrivener
A Curriculum for Cybernetics and Systems Theory Version 2.0
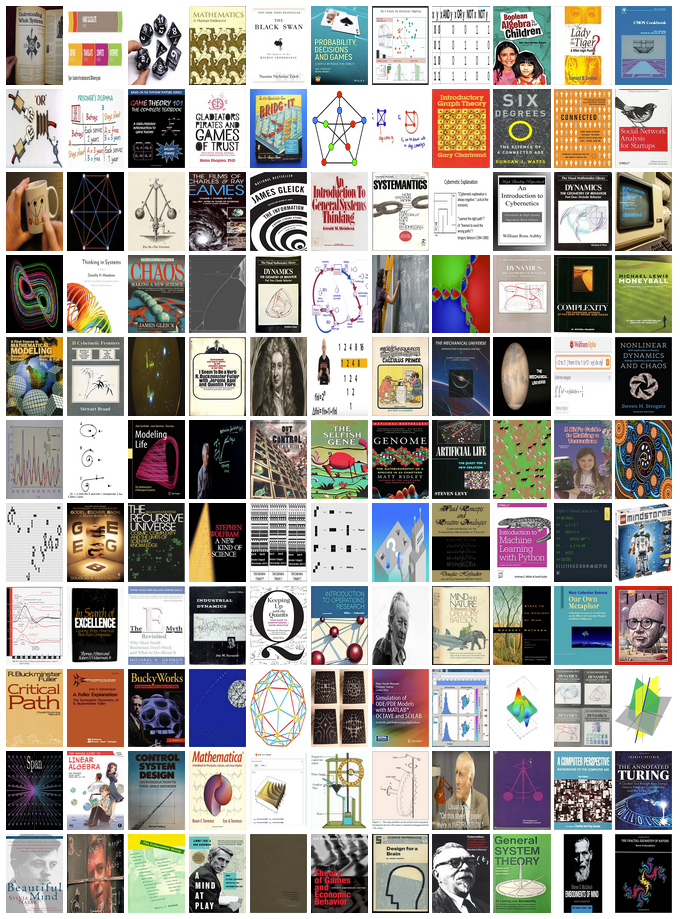 book covers and other images from the new curriculum
When a whole system is composed of a number of subsystems, the one that tends to dominate is the least stable.I've revised the Curriculum for Cybernetics and Systems Theory! From the new curriculum:— W. Ross Ashby
Background
I was first exposed to cybernetics and systems theory as a teenager in the late 1960s, when I read about them in the Whole Earth Catalog, in the first section, entitled "Understanding Whole Systems."In 1975, at Kresge College, University of California at Santa Cruz, I pursued an individual major in "Whole Systems," sponsored by Gregory Bateson, and taught a one quarter student-directed seminar in "Understanding Whole Systems."
Fifteen years later I was showing the course notes for this class to my teacher friend Jodi Reed, and she asked me how I would do it differently if I did it over. In response I wrote "A Curriculum for Cybernetics and Systems Theory" in 1990 and posted it on the web, with updates in 2002 and 2012. (It wasn't exactly a curriculum, but more of a meandering set of books reviews in the style of the Whole Earth Catalog.)
Since then there have been some game-changing developments in these fields, especially how they are taught, and I have also had some time to think about the big picture.Historical Context
I came to realize that ultimately cybernetics and systems theory represent a trendy repackaging of applied mathematics. Much of our traditional math curriculum is based more on pure mathematics, especially after grade 12, and the problems of training a new generation of mathematicians. Problems are often chosen based on elegance, and on the opportunities to expand the reach of math; proofs are emphasized, since if students are to ultimately create new math they must use proofs. But the needs of applied math are different; problems are often chosen because of societal needs, even if the exact solutions are provably impossible and approximations are inelegant.A big game changer has the rise of symbolic solvers, such as MATLAB, Octave and Mathematica (discussed below). They do all of the work except for (1) what we call the word problems, translating the questions into formulas, and then — after the computer solves the equation — (2) validating and applying the solution. With the added benefit of ubiquitous mobile networked computing (smart phones, tablets, and etc.) these solvers are now available for almost any situation.
We need to prepare students for a world in which these trends continue. Certainly it is possible that our technological civilization may collapse; every other one has. But in that case we will put our problems with math education on the back burner for at least a few decades, and have to concentrate on how to eat, which would mean learning to use a 12,000-year-old invention called "the plow." This is vividly illustrated in the first episode ("The Trigger Effect") of James Burke's TV series "Connections" (1978), at about 5:15 - 30:00.
But assuming that doesn't happen, we need to stop teaching our students as if the computing resources were unavailable or prohibitively expensive, and instead prepare them for real life in the modern era.
I Finally Got a Machine Learning Program To Learn Something
 Flynn — Hero or Villain?
( © Walt Disney Company )
Flynn — Hero or Villain?
( © Walt Disney Company )
"It's Artificial Intelligence, not Artificial Sentience."PAROCHIAL POLITICS WARNING: this essay is from the point of view of United States politics. I'm certain things are different and more complex elsewhere. ALGEBRA WARNING: this essay uses algebra, like American's usually learn in Algebra I in 10th grade. (If you ever wondered "when am I going to use this?" well today's the day.) There wont be any trig (sin/cos/tan, etc.) or logarithms or other nonlinear equations. If you are overwhelmed it might help to use the Wolfram Alpha web site or mobile app. For example, below I take the equation: c0 + c1*x + c2*y = 0 and solve for Y, getting: y = -(c1/c2)*x - c0/c2. You can type into Wolfram Alpha (ignoring the subscripting for now): c0 + c1*x + c2*y = 0 ; solve for y and it will give you this:— Abhijit Naskar
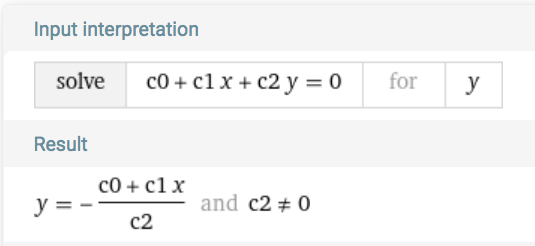 This of course is slightly different, so you still need to know how to distribute
the minus sign and division by c2 across terms, and rearrange them.
Or you could just believe me.
This of course is slightly different, so you still need to know how to distribute
the minus sign and division by c2 across terms, and rearrange them.
Or you could just believe me.
TECHNICAL BACKGROUND: 2-DIMENSIONAL CASE
"If you swim to latitude Fifty North, longitude Forty West (that is magic), you will find, sitting on a raft, in the middle of the sea, with nothing on but a pair of blue canvas breeches, a pair of suspenders (you must not forget the suspenders, Best Beloved), and a jack- knife, one ship-wrecked Mariner, who, it is only fair to tell you, is a man of infinite-resource-and-sagacity"Some of you may remember about five years ago when I first explored machine learning and described it in this e'Zine:— Rudyard Kipling (1902) "How the Whale Got His Throat" from "Just So Stories"
- Explorations in Machine Learning in
Cybernetics in the 3rd Millennium (C3M)
Volume 14 Number 1, Dec. 2017
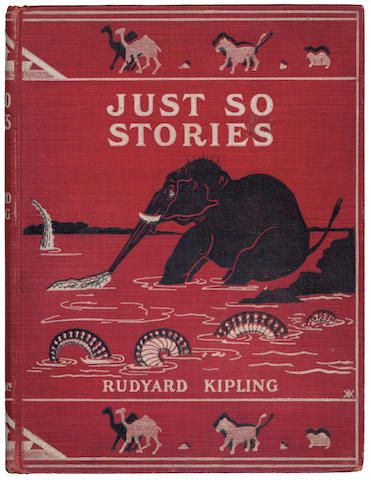 Just So Stories (1902) by Rudyard Kipling
It begins:
Just So Stories (1902) by Rudyard Kipling
It begins:
This, O Best Beloved, is another story of the High and Far-Off Times. In the very middle of those times was a Stickly-Prickly Hedgehog, and he lived on the banks of the turbid Amazon, eating shelly snails and things. And he had a friend, a Slow-Solid Tortoise, who lived on the banks of the turbid Amazon, eating green lettuces and things. And so that was all right, Best Beloved. Do you see? But also, and at the same time, in those High and Far-Off Times, there was a Painted Jaguar, and he lived on the banks of the turbid Amazon too; and he ate everything that he could catch. When he could not catch deer or monkeys he would eat frogs and beetles; and when he could not catch frogs and beetles he went to his Mother Jaguar, and she told him how to eat hedgehogs and tortoises. She said to him ever so many times, graciously waving her tail, 'My son, when you find a Hedgehog you must drop him into the water and then he will uncoil, and when you catch a Tortoise you must scoop him out of his shell with your paw.' And so that was all right, Best Beloved.When the Painted Jaguar went to use his new knowledge, a hedgehog and a tortoise got him all confused, and he tried to scoop the hedgehog out of its shell and got prickles in his paw. So that evening the Mother Jaguar taught him a poem to help:
"Can't curl, but can swim— Slow-Solid, that's him! Curls up, but can't swim— Stickly-Prickly, that's him!"SPOILER ALERT: That night the hedgehog unlaced the tortoise's shells and taught him to curl up, and the tortoise taught the hedgehog to swim, causing his prickles to stick together and form plates, so they both ended up Armadillos. But let's rewind and imagine that at the start the Painted Jaguar hired a Machine Learning (ML) expert to help him sort out the critters. Muttering "you can't manage what you can't measure," the ML expert devised tests for the critters to measure their curling and swimming capabilities on a scale of zero to ten. He listed the results in the following table.
| curl (x) | swim (y) | animal |
|---|---|---|
| 7.0 | 1.0 | Stickly-Prickly Hedgehog (red) |
| 1.0 | 7.0 | Slow-Solid Tortoise (blue) |
| 7.5 | 1.0 | Stickly-Prickly Hedgehog (red) |
| 1.5 | 7.5 | Slow-Solid Tortoise (blue) |
| 8.0 | 1.0 | Stickly-Prickly Hedgehog (red) |
| 1.0 | 8.0 | Slow-Solid Tortoise (blue) |
| 9.0 | 1.0 | Stickly-Prickly Hedgehog (red) |
| 1.0 | 9.0 | Slow-Solid Tortoise (blue) |
| ^ | s w i m |  |
| curl — > |
- c0 + c1*x + c2*y
- x = c1/c0
"Can curl, and can swim— Armadillo, that's him!And that the Machine Learning Expert departed with his expensive fee, paid in frogs and beetles.
TECHNICAL BACKGROUND: 3-DIMENSIONAL CASE
KERMIT THE FROG: ...we've also got a big musical finale from Sam Eagle. (SAM EAGLE opens another door behind KERMIT and peeks his head out.) Sam, what's it about? SAM: It's called "A Salute to All Nations, but Mostly America." (Exits back into door.) KERMIT THE FROG: Great. So it's going to be a swell demonstration — and at no time will we be stooping to any cheap 3D tricks. FOZZIE: (Enters.) Did you say cheap 3D tricks? KERMIT THE FROG: Uh... (FOZZIE blows a noisemaker twice, which comes out toward the audience.)I want to show an example with 3 columns of data (not counting the category flag) but I couldn't think of a beloved children's book to use as an example, so I made an example up. Let's say you have some containers from the grocer holding either soup or yogurt. Somehow you have number indicating the fraction of ingredients (discounting water) in the categories dairy, vegetable and fruit, as shown in this table:— "Muppets in 3D" (theme park attraction, 1991) by Jim Henson, et. al.
| food | dairy content | vegetable content | fruit content | category |
|---|---|---|---|---|
| tomato soup | 0.50 | 0.40 | 0.00 | soup |
| vegetable soup | 0.00 | 0.60 | 0.00 | soup |
| blueberry yogurt | 0.70 | 0.00 | 0.20 | yogurt |
| strawberry yogurt | 0.70 | 0.00 | 0.10 | yogurt |
| chicken broth | 0.00 | 0.01 | 0.00 | soup |
| clam chowder | 0.50 | 0.10 | 0.00 | soup |
| chicken noodle soup | 0.00 | 0.30 | 0.00 | soup |
| plain yogurt | 0.70 | 0.02 | 0.00 | yogurt |
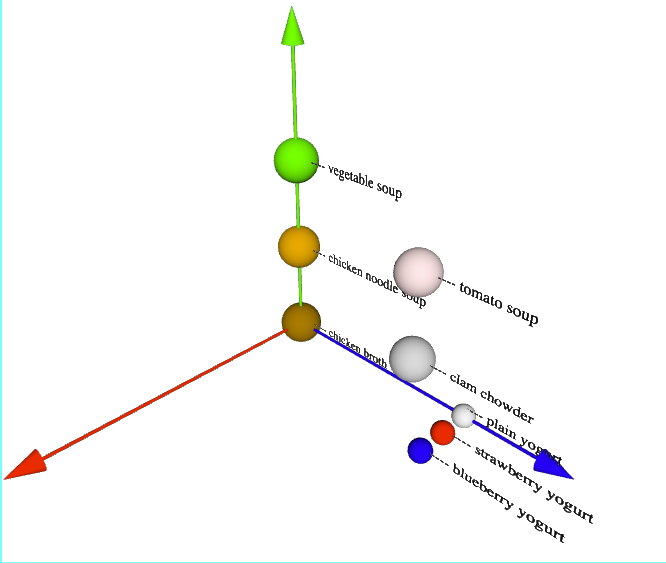 How To Tell Soup From Yogurt ( people.well.com/user/abs/swdev/w3d/soup_vs_yogurt.html )
This is an interactive display so be sure to manipulate it with mouse or fingers,
following the on-screen directions. For now, ignore the black grid through the
space.
As the key shows, the X axis — representing dairy content — is blue,
the Y axis — representing vegetable content — is green, and the Z
axis — representing fruit content — is red.
The larger spheres are soup, while the smaller ones are yogurt.
The colors are designed to be close to the colors for the food item.
Now our SVM is going to have to find a plane to divide the 3-D space, separating
the two categories as much as possible.
A simple solution would be a plane through the X axis at 45 degrees to Y and Z,
defined by the equation y = z, except for a tricky point: chicken broth (brown),
which is the origin (x = y = z = 0). Clearly the plane can't pass through this
point, so a solution is needed that is offset in X, Y and/or Z, which is why we
need the C0 coefficient.
We give our SVM the table of numbers:
0.50,0.40,0.00,2
0.00,0.60,0.00,2
0.70,0.00,0.20,1
0.70,0.00,0.10,1
0.00,0.01,0.00,2
0.50,0.10,0.00,2
0.00,0.30,0.00,2
0.70,0.02,0.00,1
with 1 meaning yogurt and 2 meaning soup, and tell it to use the first four
rows as training data and the last 4 rows as testing data. As always we've mixed
up the two categories so the training set and testing set get enough of each.
We get back coefficients:
c0 = 0.0409
c1 = -0.0741
c2 = 0.1160
c3 = -0.2712
In the 3D case our separating plane is defined by the linear equation:
c0 + c1*x + c2*y + c3*z = 0
When the expression on the left hand side adds up to zero, a given XYZ point is on
the dividing plane. If it's positive, the point is in the soup region, and when
it's negative the point is in the yogurt region.
(Note that the values of the coefficients c0 through c3,
and the values of a, b and c, are the same throughout a run of the classifier,
while the values of x, y and z change with every data row.)
We can use this to test the data rows to see if the classifier works, as I've done
in a Google Sheets spreadsheet, screen-capped here:
How To Tell Soup From Yogurt ( people.well.com/user/abs/swdev/w3d/soup_vs_yogurt.html )
This is an interactive display so be sure to manipulate it with mouse or fingers,
following the on-screen directions. For now, ignore the black grid through the
space.
As the key shows, the X axis — representing dairy content — is blue,
the Y axis — representing vegetable content — is green, and the Z
axis — representing fruit content — is red.
The larger spheres are soup, while the smaller ones are yogurt.
The colors are designed to be close to the colors for the food item.
Now our SVM is going to have to find a plane to divide the 3-D space, separating
the two categories as much as possible.
A simple solution would be a plane through the X axis at 45 degrees to Y and Z,
defined by the equation y = z, except for a tricky point: chicken broth (brown),
which is the origin (x = y = z = 0). Clearly the plane can't pass through this
point, so a solution is needed that is offset in X, Y and/or Z, which is why we
need the C0 coefficient.
We give our SVM the table of numbers:
0.50,0.40,0.00,2
0.00,0.60,0.00,2
0.70,0.00,0.20,1
0.70,0.00,0.10,1
0.00,0.01,0.00,2
0.50,0.10,0.00,2
0.00,0.30,0.00,2
0.70,0.02,0.00,1
with 1 meaning yogurt and 2 meaning soup, and tell it to use the first four
rows as training data and the last 4 rows as testing data. As always we've mixed
up the two categories so the training set and testing set get enough of each.
We get back coefficients:
c0 = 0.0409
c1 = -0.0741
c2 = 0.1160
c3 = -0.2712
In the 3D case our separating plane is defined by the linear equation:
c0 + c1*x + c2*y + c3*z = 0
When the expression on the left hand side adds up to zero, a given XYZ point is on
the dividing plane. If it's positive, the point is in the soup region, and when
it's negative the point is in the yogurt region.
(Note that the values of the coefficients c0 through c3,
and the values of a, b and c, are the same throughout a run of the classifier,
while the values of x, y and z change with every data row.)
We can use this to test the data rows to see if the classifier works, as I've done
in a Google Sheets spreadsheet, screen-capped here:
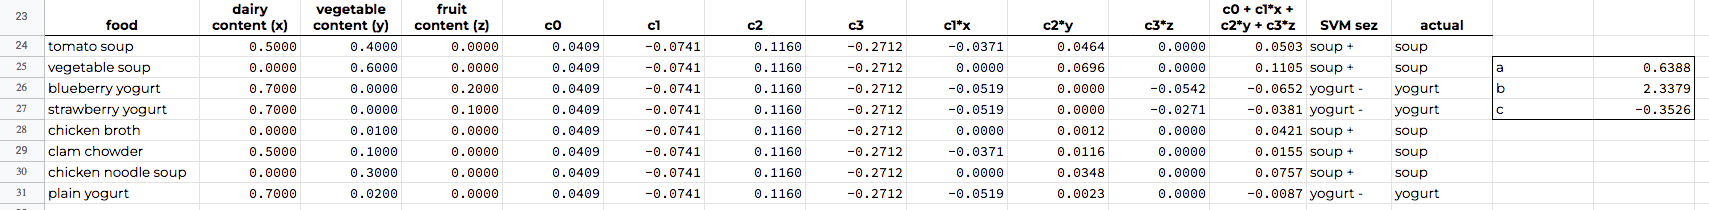 For example, the tomato soup row has x = 0.50, y = 0.40 and z = 0.00
for the data values. Plugging them into the left hand side of the above equation,
we get 0.0503, which is positive, so tomato soup is classified as a soup.
(Note that the values of the coefficients c0 through cn
are the same throughout a run of the classifier, while the values of x1
through xn change with every data row.)
If we want to plot the dividing plane, we need to rearrange the linear equation
to solve for Y. We'd like it in the form:
y = a*x + b*z + c
Note that the c here is completely different from the coefficients c0,
c1, etc. In that case the c stands for coefficient. Here c is just
the next letter after a and b.
Why am I solving for Y you may ask? I could solve for X, Y or Z (except in the
case where a coefficient is zero, because then you can't divide it out). All
three would yield the equation for a plane in 3-D space. I just am used to
X going to the right and Y going up, as we saw in the 2-D plot of Hedgehogs
and Tortoises, and I'm also used to adding Z coming out of the screen in the 3-D
case. So I think of a plane as defined by some linear function of Y for all
values of X and Z.
Doing the algebra we get:
a = c1*x/c2
b = c3*z/c2
c = c0/c2
You can see the a, b and c values on the right side of the spreadsheet shown above.
I plotted this plane as a black grid in the 3-D interactive display linked above.
It's a little tricky to comprehend because the grid elements are not close to
being squares, but instead are closer to elongated parallelagrams. If you rotate
the display so that you are mostly looking down the Y axis (given the difficulty
introduced by perspective) you will see the grid looking more like squares.
I plotted this grid by talking X and Z values in discrete intervals, and then
computing Y using the above equation for the plane. This plane divides the soup
from the yogurt with 100% accuracy. Note that the plane doesn't pass through the
origin.
In the 2D case we explained that the SVM algorithm finds the thickest ribbon that
divides the types, and uses its center line as the separator. Now in the 3D case
the algorithm finds the thickest slab (infinite in 2 dimensions and finite in 1)
that divides the types, and uses its center plane as the separator.
For example, the tomato soup row has x = 0.50, y = 0.40 and z = 0.00
for the data values. Plugging them into the left hand side of the above equation,
we get 0.0503, which is positive, so tomato soup is classified as a soup.
(Note that the values of the coefficients c0 through cn
are the same throughout a run of the classifier, while the values of x1
through xn change with every data row.)
If we want to plot the dividing plane, we need to rearrange the linear equation
to solve for Y. We'd like it in the form:
y = a*x + b*z + c
Note that the c here is completely different from the coefficients c0,
c1, etc. In that case the c stands for coefficient. Here c is just
the next letter after a and b.
Why am I solving for Y you may ask? I could solve for X, Y or Z (except in the
case where a coefficient is zero, because then you can't divide it out). All
three would yield the equation for a plane in 3-D space. I just am used to
X going to the right and Y going up, as we saw in the 2-D plot of Hedgehogs
and Tortoises, and I'm also used to adding Z coming out of the screen in the 3-D
case. So I think of a plane as defined by some linear function of Y for all
values of X and Z.
Doing the algebra we get:
a = c1*x/c2
b = c3*z/c2
c = c0/c2
You can see the a, b and c values on the right side of the spreadsheet shown above.
I plotted this plane as a black grid in the 3-D interactive display linked above.
It's a little tricky to comprehend because the grid elements are not close to
being squares, but instead are closer to elongated parallelagrams. If you rotate
the display so that you are mostly looking down the Y axis (given the difficulty
introduced by perspective) you will see the grid looking more like squares.
I plotted this grid by talking X and Z values in discrete intervals, and then
computing Y using the above equation for the plane. This plane divides the soup
from the yogurt with 100% accuracy. Note that the plane doesn't pass through the
origin.
In the 2D case we explained that the SVM algorithm finds the thickest ribbon that
divides the types, and uses its center line as the separator. Now in the 3D case
the algorithm finds the thickest slab (infinite in 2 dimensions and finite in 1)
that divides the types, and uses its center plane as the separator.
TECHNICAL BACKGROUND: N-DIMENSIONAL CASE
"You're still not thinking four-dimensionally!"So now we're going to look at generalizing to the N-dimensional case. This is important because the real power of SVMs comes when you give them large datasets, with as thousands of columns and many dozens of rows. One of the biggest wins reported was in gene classification of tissue samples, for 2000+ gene types in nearly a hundred samples, discussed in:— Doc Brown to Marty McFly in "Back To the Future III" (1990) screenplay by Bob Gale
- BIOwulf's Mathematical Tools: New Breakthroughs In Machine Learning
19 July 2001
- Biological Computing: The Next Big Thing? (Part Two) in
Cybernetics in the 3rd Millennium (C3M)
Volume 2 Number 3, Mar. 2003
(search for "Here is an excerpt from the screenplay")
To sneak up on the N-dimensional case, let's rewind first to the rather trivial
1-dimensional case. Suppose you live in a jurisdiction where minors are
under eighteen years old, and you have a list of individuals ages and wheher
they are minors which you want to use to train a SVM:
- Disney Stock prices I tried to predict if publicly traded stocks for the Walt Disney Company would close higher or lower based on simple publicly-available data. It didn't work and I didn't expect it to. Believe markets are usually efficient, and if this pattern was there it would have been detected and exploited until it vanished by arbitrageurs.
- railroad station longevity I had a table of data from another project and used it to try to predict whether an old railroad station was still standing based on year built and location. No dice.
- deliberately buried data I chose arbitrary coefficients for the linear equation and then used it to sort random data into two classifications. I then used the classified data to train and test a SVM. It found coefficient values close to mine (after scaling, since linear equations can always be multiplied by a constant). Finally a victory, although I had to admit I put that needle in that haystack before I found it.
- Haberman dataset The Haberman dataset is a standard dataset often distributed with SVM software to us as a test. It is also featured in several tutorials. Oddly, though, it is very difficult to classify with any Machine Learning algorithm. I wasn't very successful either. But why?
- "The Seven Faces of Doctor Lao" (movie, 1964) set in 19th century Arizona, had the feisty small town newspaper editor/publisher/typesetter/printer's devil who fought corrupt big business and had thugs smash his press.
- On "The Magical World of Disney" (TV show, 1965) there was a three episode story starting with season 11 episode 16, "The Adventures of Gallegher" about a boy reporter around 1900 who helped a town fight corruption.
- "All the President's Men" (movie, 1976) quoted above was a riveting tale, given that most the action was people talking, about the Washington Posts's investigation of the Nixon Watergate scandal, and how it influenced the nation.
- "Lou Grant" (TV show, 1977-1982), a spin-off from "The Mary Tyler Moore Show," followed a TV producer as he fulfilled his dream, becoming a newspaper editor, and the struggles he faced. This show pointed out to me that newspaper writers tend to be liberal and newspaper owners tend to be conservative.
- "I. F. Stone's Weekly" (documentary film, 1973) was something I saw in college, about an amazing one-man newsletter produced by a reporter who got black-listed during the Joseph McCarthy anti-communism crusades. Though quite liberal in his views, Stone excelled at exposing lies by the Democratic administration of Lyndon B. Johnson.
- The term illegal alien was replaced with undocumented worker (or variants) by many left-leaning news sources. This despite the use of the original language in federal law, and so the new term creates confusion. Frequently the argument was to humanize these people, and maybe that's a good thing, but it is the methodology of propaganda.
- The term suicide bomber was replaced with homicide bomber by at least one right-leaning news source. This despite the fact that most bombers intend to cause homicides, and so the new term creates confusion. Frequently the argument was to try to strip away any implication of heroism, and maybe that's a good thing, but it is the methodology of propaganda.
| age | minor? |
|---|---|
| 13.0 | yes |
| 18.0 | no |
| 13.5 | yes |
| 18.5 | no |
| 14.0 | yes |
| 19.0 | no |
| 14.5 | yes |
| 19.5 | no |
| 15.0 | yes |
| 20.0 | no |
| 15.5 | yes |
| 20.5 | no |
| 16.0 | yes |
| 21.0 | no |
| 16.5 | yes |
| 21.5 | no |
| 17.0 | yes |
| 22.0 | no |
| 17.5 | yes |
| 22.5 | no |
 The rightmost red point is age 17.5, and the leftmost green point is age 18.
Clearly the best separator is the point at 17.75 (shown in black). The algorithm
finds the best, widest line segment to separate the values, and uses its midpoint.
Now that we have a bunch of info about the 1, 2 and 3-D cases, let's put them in
a table:
The rightmost red point is age 17.5, and the leftmost green point is age 18.
Clearly the best separator is the point at 17.75 (shown in black). The algorithm
finds the best, widest line segment to separate the values, and uses its midpoint.
Now that we have a bunch of info about the 1, 2 and 3-D cases, let's put them in
a table:
| dimension of data | dimension of separator | dimensions of "slab" | linear equation | separator equation |
|---|---|---|---|---|
| 1 (line) | 0 (point) | 1 finite (line segment) | c0 + c1*x1 = 0 | x1 = -c0/c1 |
| 2 (plane) | 1 (line) | 1 infinite, 1 finite (ribbon) | c0 + c1*x1 + c2*x2 = 0 | x1 = -c0/c1 - (c2/c1)*x2 |
| 3 (space) | 2 (plane) | 2 infinite, 1 finite (slab) | c0 + c1*x1 + c2*x2 + c3*x3 = 0 | x1 = -c0/c1 - (c2/c1)*x2 - (c3/c1)*x3 |
| 4 (hyperspace) | 3 (space) | 3 infinite, 1 finite (hyperslab) | c0 + c1*x1 + c2*x2 + c3*x3 + c4*x4 = 0 | x1 = -c0/c1 - (c2/c1)*x2 - (c3/c1)*x3 - (c4/c1)*x4 |
| * * * | ||||
| n (N-space) | n - 1 (N_MINUS_1-space) | N_MINUS_1 infinite, 1 finite (N-slab) | c0 + c1*x1 + c2*x2 + c3*x3 + ... + cn*xn = 0 | x1 = -c0/c1 - (c2/c1)*x2 - (c3/c1)*x3 - ... - (cn/c1)*xn |
TECHNICAL BACKGROUND: PRIOR ATTEMPTS
"There's a lot of problems in the world that can really be solved by applying two or three times the persistence that other people will."About five years ago I had access to a SVM from a job project, and decided to see if I could get it to do something useful. I detailed this in the above-mentioned article.— a young hacker quoted in "Hackers: Heroes of the Computer Revolution" (1984) by Steven Levy
- Explorations in Machine Learning in
Cybernetics in the 3rd Millennium (C3M)
Volume 14 Number 1, Dec. 2017
JOURNALISM BACKGROUND
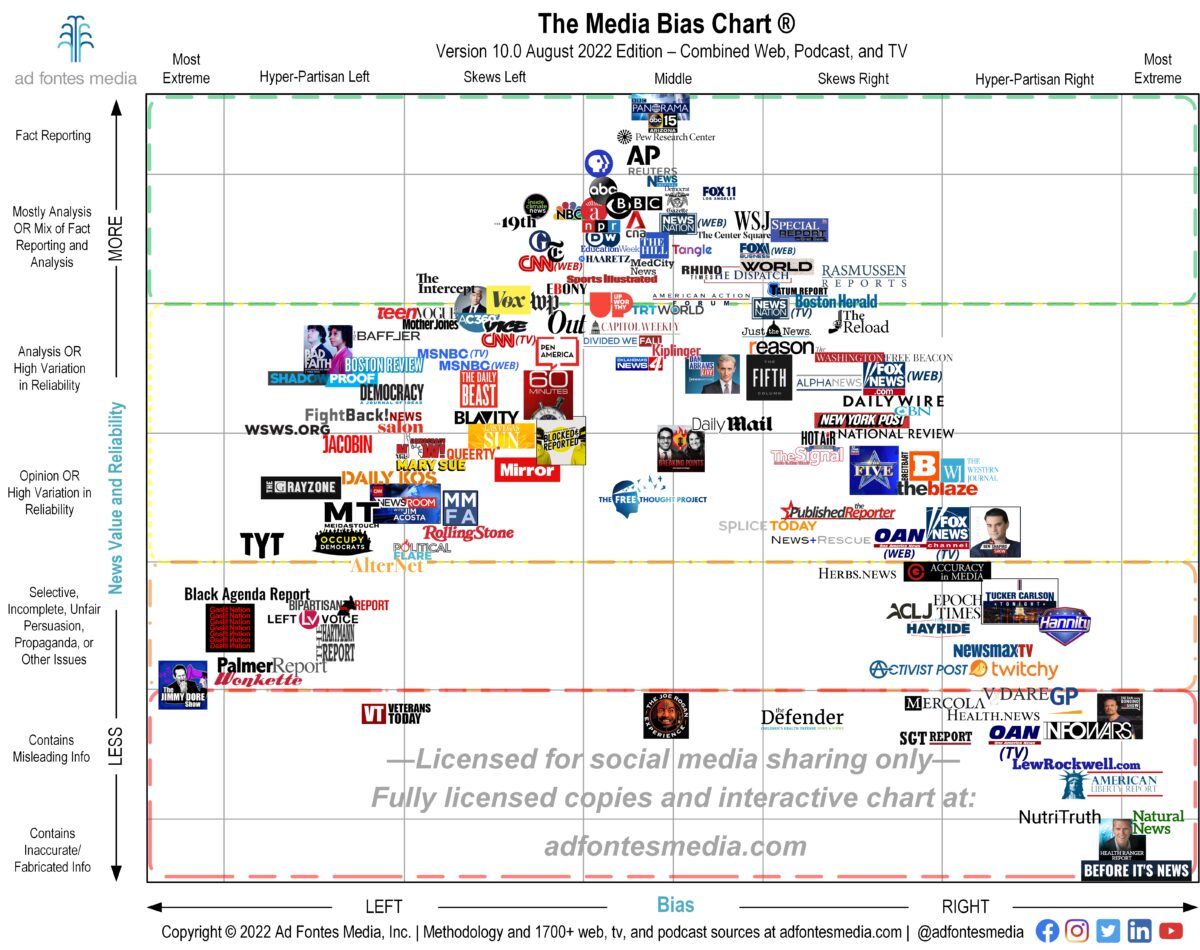 a media bias chart
( from adfontesmedia.com/static-mbc )
a media bias chart
( from adfontesmedia.com/static-mbc )
"You know the results of the latest Gallup Poll? Half the country never even heard of the word Watergate. Nobody gives a sh*t. You guys are probably pretty tired, right? Well, you should be. Go on home, get a nice hot bath. Rest up... 15 minutes. Then get your asses back in gear. We're under a lot of pressure, you know, and you put us there. Nothing's riding on this except the, uh, first amendment to the Constitution, freedom of the press, and maybe the future of the country. Not that any of that matters, but if you guys f*ck up again, I'm gonna get mad. Goodnight."I was raised to tell the truth. Later I learned to filter this, keep other's confidences and honor Non-Disclosure Agreements, and don't say hurtful things needlessly, but all in all I learned that honesty was the best policy. The Law and the Bible prohibit perjury, i.e. lying under oath, but we are free to lie otherwise. The catch is that it damages our reputations. As a Boy Scout I was in a troop that had to memorize the "long version" of the Scout Laws fond in the Boy Scout Handbook. (Our Scout Leader was a former Marine Corps. drill sergeant.) The short form of the laws was:— Washington Post editor Ben Bradlee quoted in "All the President's Men" (film, 1976) screenplay by William Goldman
"TRUSTWORTHY, LOYAL, HELPFUL, FRIENDLY, COURTEOUS, KIND, OBEDIENT, CHEERFUL, THRIFTY, BRAVE, CLEAN AND REVERENT"The long version of the laws began:
"A Scout is TRUSTWORTHY. A Scout's honor is to be trusted. If he were to violate his honor by telling a lie, or by cheating, or by not doing exactly a task when trusted on his honor, he may be directed to hand over his Scout Badge."I'm amazed I still remember it. We took it pretty seriously. As a teenager I was a big fan of Robert A. Heinlein's science fiction novels, and soon found his classic "Stranger In a Strange Land" (1961). ( www.amazon.com/exec/obidos/ASIN/0441790348/hip0bd ) It contained the job description of a "fair witness." It was someone you could get to testify to their observations of events, who had a reputation of never telling a lie. The example was you point to a white house you can see and ask them what color it is, and they say "it's white on this side." My friends and I sometimes aspired to this. Now I know truth is a slippery thing. Philosophical disputes and confusions about go back at least as far as the Sufis, and Ancient Greeks spent a lot of time debating about it. The fair witness in me must admit that I don't know for sure if France exists, or if the ground beneath me will continue to support me and not collapse into a sink hole. But none of us is usually required to know something for sure. In the Law we use the standard of "beyond a reasonable doubt" so we can get things done. This usually works pretty well. I also grew up learning to to value the "Fourth Estate," appreciating the role of a free press in a democracy. The movies and TV shows I watched often reinforced these values.
POLITICAL BACKGROUND
"There's battle lines being drawn Nobody's right if everybody's wrong * * * Singing songs and they carrying signs Mostly say, 'Hooray for our side'"The oldest president I remember was Dwight D. Eisenhower, "Ike." It was during his administration that Senator Joseph McCarthy went on his vendetta against Communists in government and industry. I was too young to be aware of it, but I certainly heard a lot about it later. On the one hand I understand we'd just exited a hot war against Communists, which ended in a stalemate but no truce, fighting Communist Koreans and sometimes Communist Chinese, with assistance from Soviet Communists. So it was easy to identify Communist equals Enemy. But, on the other hand, these were American citizens being bullied by a Senate committee solely because of a political party they belonged to. Skipping right over the elephant in the room in US politics in the John F. Kennedy administration, the assassination of JFK, we move past the duplicitous LBJ years to the Richard M. Nixon administration. I didn't see it until later, because I was blinded by loathing of Nixon (a widely-held feeling), but later it became clear that there was a quiet "get Nixon" movement, partly a payback for the blacklists. And skipping over the spooky George H. W. Bush administration, during the William J. Clinton administration it was obvious there was a "get Clinton" effort which began as an inquiry into to Whitewater investments (making it a cinch there would Whitewatergate headlines) and morphed into the Lewinski scandal. Some of this was payback for the Watergate investigations. And lastly we skip over the George W. Bush administration, despite the temptation to dive into 9/11 ramifications, and arrive at the widespread and overt "get Trump" effort which began in the administration of Barrack H. Obama. (Note that as I write this we anticipate a newly-seated House with a Republican majority to begin the "get Biden" attack in earnest, in part for payback for the Trump investigations and impeachments.) And so it goes. Since the mid-1980s or so I have been a Libertarian. I'm not going to explain or defend that right now, but be aware I came by views slowly and would probably change them slowly, I expect that's often true for others. I respect other people's opinions (usually) and don't do much to try to change them, preferring to find common ground. I do recommend taking the quiz below, because it introduces the idea that political views can be plotted on a 2-dimensional axis instead of just the one-dimensional left/right blue/red liberal/conservative axis.— "For What Its Worth" (1967) by Stephen Stills, sung by Buffalo Springfield
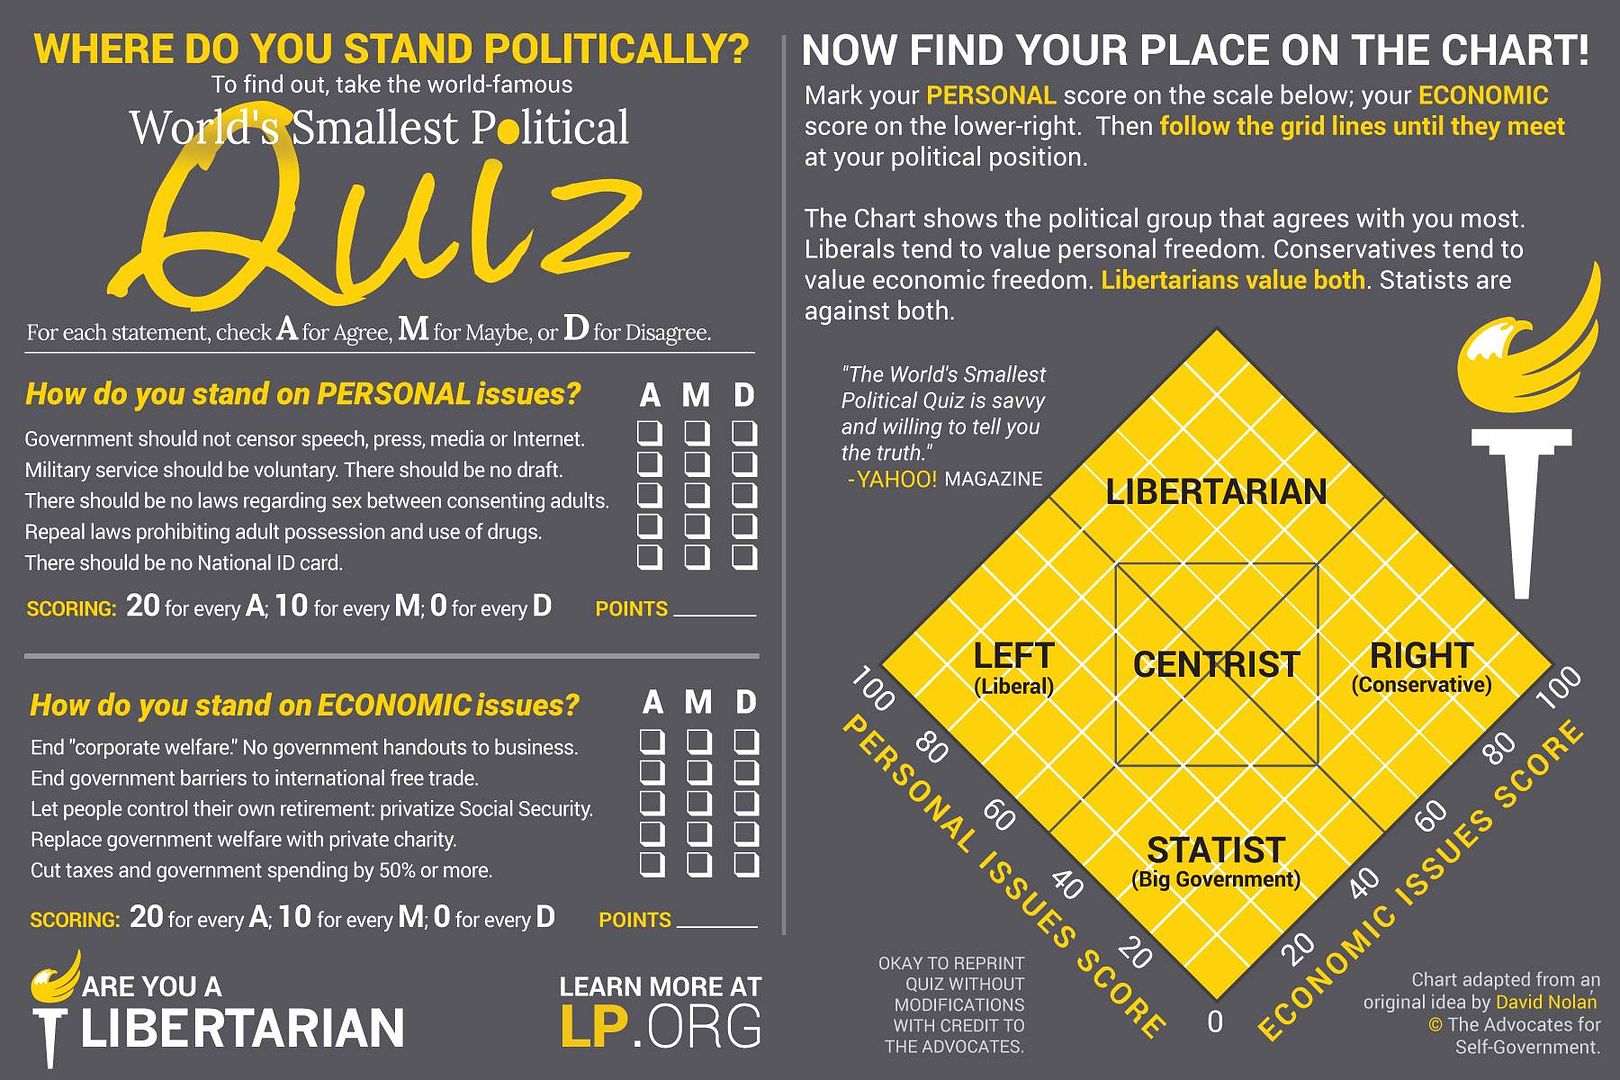 "World's Smallest Political Quiz" from lpedia.org/w/images/f/f0/2018-branded-nolan-handout.jpg
Sitting over here in the Libertarian corner I've noticed that politics is becoming
more irrational, more tribal, and less involved with dialog. Oh, dear.
News reporting has reacting by picking sides, and preaching to their respective
choirs.
As an aspiring Fair Witness I would like to see more acknowledgement that some
stories are controversial. It is possible to be objective about these things.
(The rate of Wikipedia edits of an article is a good metric.)
One uncomfortable truth, IMHO, is that in many "culture war" issues both
sides sincerely believe they have the moral high ground, a fact that almost
nobody wants to ponder.
It was into the early days of the Presidential phase of the "get Trump" project
(codename "Crossfire Hurricane") that the troubles with Michael Flynn arose.
The Fair Witness report from me is that I don't know what's true about this case.
It would probably take a lot of work to find out. I do know what both sides have
been saying. In early 2020 the Justice Department began a prosecution of Flynn
for lying to the FBI in an interview. Eventually Flynn pleaded guilty, but then
later alleged prosecutor misconduct and tried to change hies plea. Though
prosecutors agreed the judge refused, and it was tied up in messy appeals when
President Trump pardoned Flynn in Nov. 2020, ending the case.
One day in the middle of 2020, working a side-hustle and driving around, I was
listening to talk radio, which in my market means either right-wing talk radio
or NPR. I had opted for the Sean Hannity show. It isn't in the above chart, but
he is a frequent guest on Fox News so I'd say he's somewhere in the hyper-partisan
right. He was interviewing a lawyer who was covering the Michael Flynn case. The
reporter went into detail about alleged prosecutor misconduct, withholding
exculpatory evidence and other misdeeds. Then there was an hourly news break,
provided by CBS radio. They are also not on the chart but I'd peg them as
slightly left skewed. They summarized the Michael Flynn case saying he admitted
to his crimes and pleaded guilty twice, and now was changing his story. Hmmm,
I thought.
The pattern I noticed was that you could tell the media bias but the presence or
absence of these four words:
admitted
pleaded
exculpatory
misconduct
"World's Smallest Political Quiz" from lpedia.org/w/images/f/f0/2018-branded-nolan-handout.jpg
Sitting over here in the Libertarian corner I've noticed that politics is becoming
more irrational, more tribal, and less involved with dialog. Oh, dear.
News reporting has reacting by picking sides, and preaching to their respective
choirs.
As an aspiring Fair Witness I would like to see more acknowledgement that some
stories are controversial. It is possible to be objective about these things.
(The rate of Wikipedia edits of an article is a good metric.)
One uncomfortable truth, IMHO, is that in many "culture war" issues both
sides sincerely believe they have the moral high ground, a fact that almost
nobody wants to ponder.
It was into the early days of the Presidential phase of the "get Trump" project
(codename "Crossfire Hurricane") that the troubles with Michael Flynn arose.
The Fair Witness report from me is that I don't know what's true about this case.
It would probably take a lot of work to find out. I do know what both sides have
been saying. In early 2020 the Justice Department began a prosecution of Flynn
for lying to the FBI in an interview. Eventually Flynn pleaded guilty, but then
later alleged prosecutor misconduct and tried to change hies plea. Though
prosecutors agreed the judge refused, and it was tied up in messy appeals when
President Trump pardoned Flynn in Nov. 2020, ending the case.
One day in the middle of 2020, working a side-hustle and driving around, I was
listening to talk radio, which in my market means either right-wing talk radio
or NPR. I had opted for the Sean Hannity show. It isn't in the above chart, but
he is a frequent guest on Fox News so I'd say he's somewhere in the hyper-partisan
right. He was interviewing a lawyer who was covering the Michael Flynn case. The
reporter went into detail about alleged prosecutor misconduct, withholding
exculpatory evidence and other misdeeds. Then there was an hourly news break,
provided by CBS radio. They are also not on the chart but I'd peg them as
slightly left skewed. They summarized the Michael Flynn case saying he admitted
to his crimes and pleaded guilty twice, and now was changing his story. Hmmm,
I thought.
The pattern I noticed was that you could tell the media bias but the presence or
absence of these four words:
admitted
pleaded
exculpatory
misconduct
EXPERIMENT ONE
"Something seems rotten in Flynn's case — and maybe others, too"So the idea struck me that maybe I could get my SVM software to detect media bias. I found 28 news stories about the Flynn case and counted the frequency of the four words: admitted exculpatory pleaded misconduct I manually scraped the text for the stories off their web sites, using my mouse, and then used Python code to do word counts. After some examination of the data I added forms of pleaded to its count: plea plead I also tagged the stories with 1 if Left and 2 if Right. Mostly I used mediabiasfactcheck.com to gauge bias. If a site was "on the line" I counted them as Right, since there were fewer of those and the algorithm I wanted to use works best if the categories are close to equal in size. As always we've mixed up the two categories so the training set and testing set get enough of each. I fed the data to my binary Support Vector Machine (SVM) in the Apache Spark package SystemML. (ML stands for Machine Learning.) For more info about this tool see the above links to c3M articles. Well, it worked like a charm, getting the right answer about 93% of the time. The technique broke the dataset into a training set (14 data points) which trained the machine, and then a testing dataset (also 14 data points) which tested the machine. It scored 13 out of 14 right! A simplistic conclusion would be that the bias in media is so obvious a robot can find it (if you spoon feed them the data). A detailed look at the input data and SVM outputs is in the table blow:— The Hill editorial headline April 30, 2020
"Michael Flynn's scrapped plea deal and escape from justice is even worse than it seems"— NBC News editorial headline June 25, 2020
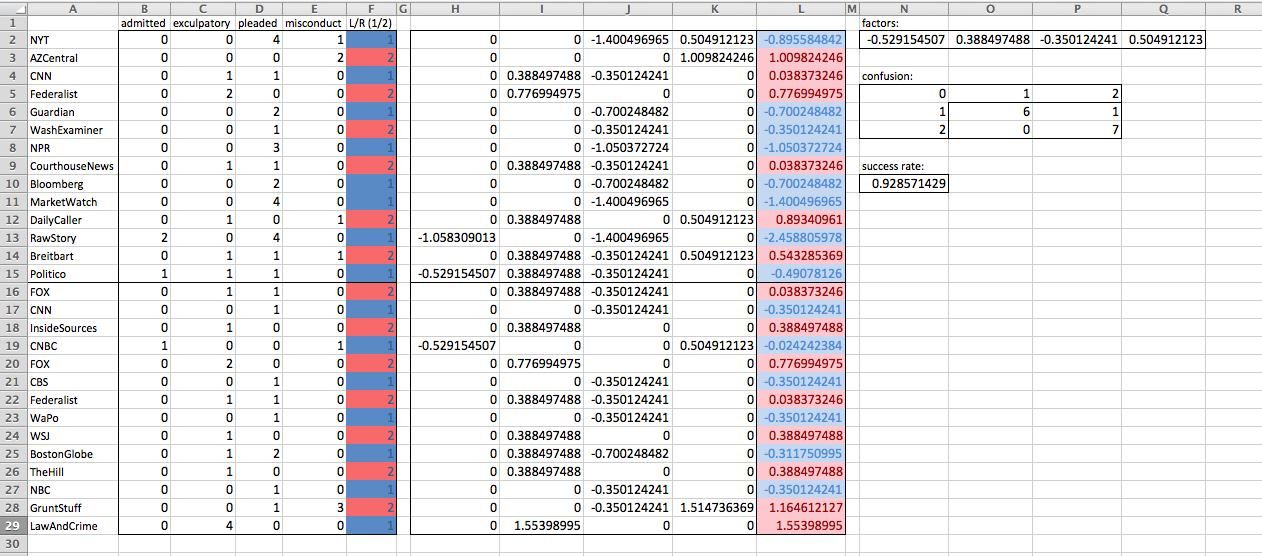 The five unlabeled columns are the four data points for that row multiplied by the four coefficients labeled "factors") from the SVM: c1 through c4
and the fifth column is their sum, the resulting value of the classifier function
(negative is L, blue, flag=1, and positive is R, red, flag=2).
The five unlabeled columns are the four data points for that row multiplied by the four coefficients labeled "factors") from the SVM: c1 through c4
and the fifth column is their sum, the resulting value of the classifier function
(negative is L, blue, flag=1, and positive is R, red, flag=2).
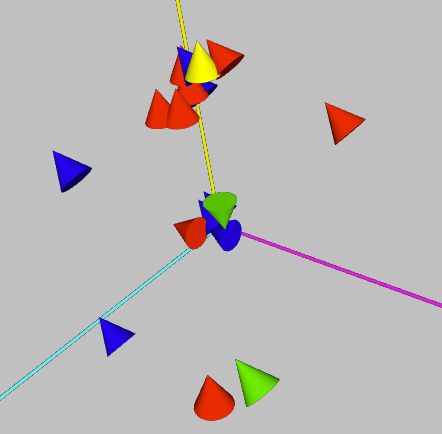 For fun I attempted a 3-D visualization of the 4-D data.
The magenta axis is the count of "admitted" words, the yellow axis is
"exculpatory" words and the cyan axis is "pleaded" words and variants.
The count of "misconduct" (the fourth dimension of data) is indicated by how
tilted the cone is away from vertical. The colors indicate classifications
— blue is left and red is right for correct guesses by the SVM; green
is left and yellow is right for incorrect guesses.
For fun I attempted a 3-D visualization of the 4-D data.
The magenta axis is the count of "admitted" words, the yellow axis is
"exculpatory" words and the cyan axis is "pleaded" words and variants.
The count of "misconduct" (the fourth dimension of data) is indicated by how
tilted the cone is away from vertical. The colors indicate classifications
— blue is left and red is right for correct guesses by the SVM; green
is left and yellow is right for incorrect guesses.
EXPERIMENT ONE EXTENSIONS
Bullwinkle J. Moose: Hey, Rocky; watch me pull a rabbit outta my hat! Rocket J. Squirrel: Again? Bullwinkle J. Moose: Nothin' up my sleeve - Presto! [pulls Rocky out of the hat] Well, I'm gettin' close.I wanted to see if the SVM could be giving me clues to which words were less necessary to perform the classification. I reran the SVM with less data, using only the top two words (highest absolute values of factors from the 4-column run): admitted (factor = -0.529...) and misconduct (factor=0.504...) and only got about 57% right. Guessing would've yielded about 50%. (New factors from the 2-column run were -0.5 and 0.374.) Another thing I wanted to try was adding columns which were the products of every pair of columns in the data. Dr. Guyon once told me this could find non-linearities. I did neglect to include each column times itself, but no matter. The confusion matrix was: 0,1.0,2.0 1.0,5.0,2.0 2.0,0,7.0 showing 12 out of 14, or 85.7142...% success rate, lower than the almost 93% I got with the original data. Poor thing, I confused it.
EXPERIMENT TWO
Bullwinkle: Hey, Rocky! Watch me pull a rabbit out of my hat. Rocky: Again? Bullwinkle: (tears off a shirt sleeve) Nothing up my sleeve. Presto! (reaches hand into hat and pulls out the head of a lion) Bullwinkle: No doubt about it, I gotta get another hat.I decided that a more advanced test would be to count many more words. The SVM algorithm is supposed to be good at eliminating useless data, so if I count all the uncommon words (ignoring words like the, and, if, not, etc.) it should tell me which words are indicators for bias. This did not work so well. I was using stories about the Black Lives Matter related civil actions in Portland, Oregon, which the left called "protests" and the right called "riots." The SVM seemed to be drifting around, changing its mind about the most important words. Also, for every story I was still cut-and-pasting by hand and mouse, and then hand-filtering out links to other stories and ads. This made progress slow. My last attempts in Sep. 2020 were working on a word list of 100: 1. politics 2. edition 3. federal 4. safety 5. fallen 6. tennis 7. enforcement 8. fashion 9. reliable 10. cubic 11. publisher 12. phone 13. pandemic 14. secretary 15. mime 16. violence 17. tiger 18. adviser 19. fence 20. agriculture 21. fade 22. assignment 23. voter 24. referrer 25. swing 26. given 27. beta 28. ruth 29. contact 30. leader 31. saying 32. adjust 33. boa 34. geography 35. morgan 36. estate 37. days 38. fidelity 39. reckoning 40. morris 41. navy 42. infantryman 43. forwards 44. firsthand 45. slot 46. wardman 47. familiar 48. emu 49. lemonade 50. restaurant 51. anti 52. respect 53. union 54. quarterly 55. launcher 56. pan 57. alignment 58. cape 59. vanity 60. zoom 61. tower 62. cisco 63. decision 64. vaccine 65. swear 66. bum 67. vanguard 68. cit 69. sub 70. studio 71. turnout 72. associated 73. ceremony 74. storm 75. russia 76. disease 77. enterprise 78. parker 79. contextual 80. legacy 81. wake 82. almost 83. confirmed 84. homeland 85. racial 86. getting 87. wolf 88. contributor 89. accountability 90. distribution 91. businessman 92. weekend 93. mask 94. avoid 95. dynamic 96. advantage 97. vast 98. productid 99. cable 100. zero This word list made little sense to me. Using it I was getting results of about 60% accuracy. I made some efforts at automating the web scraping using Python code, but it mysteriously failed in some cases. I set the project aside for a while.
FUTURE WORK
"It's just been a sort of dress rehearsal, and we're just getting started. So if any of you start to rest on your laurels, just forget it."In preparing for this article, I've made dramatic improvements to simplifying the way I use the SVM software. But I've also found it to be troublesome. The documentation is sometimes wrong, or just missing. The hosting has moved around and active development seems to have stopped. A query to the subreddit r/systemml made two years ago is still unanswered. I'm afraid it's an orphan technology. When I run it I get Java errors (it's based on Java) saying its using deprecated features that may go away in a future release. It may break any day. [UPDATE: SystemML has become SystemDS, and now resides at: — the DS stands for Data Science.] Full disclosure, while working with it on this essay I found it failed utterly in the 1-D case and gave wrong answers for c0 in all cases; I fudged the values for my examples. I found an article about another SVM package that runs on the statistics language/package R, but then I found my version of R is outdated for my MacOS, and so I'll check that out on another day.— Walt Disney at the 10th anniversary of Disneyland, 1965
- Machine Learning Using Support Vector Machines
If It's Just a Virtual Actor, Then Why Am I Feeling Real Emotions? (Part Eight)

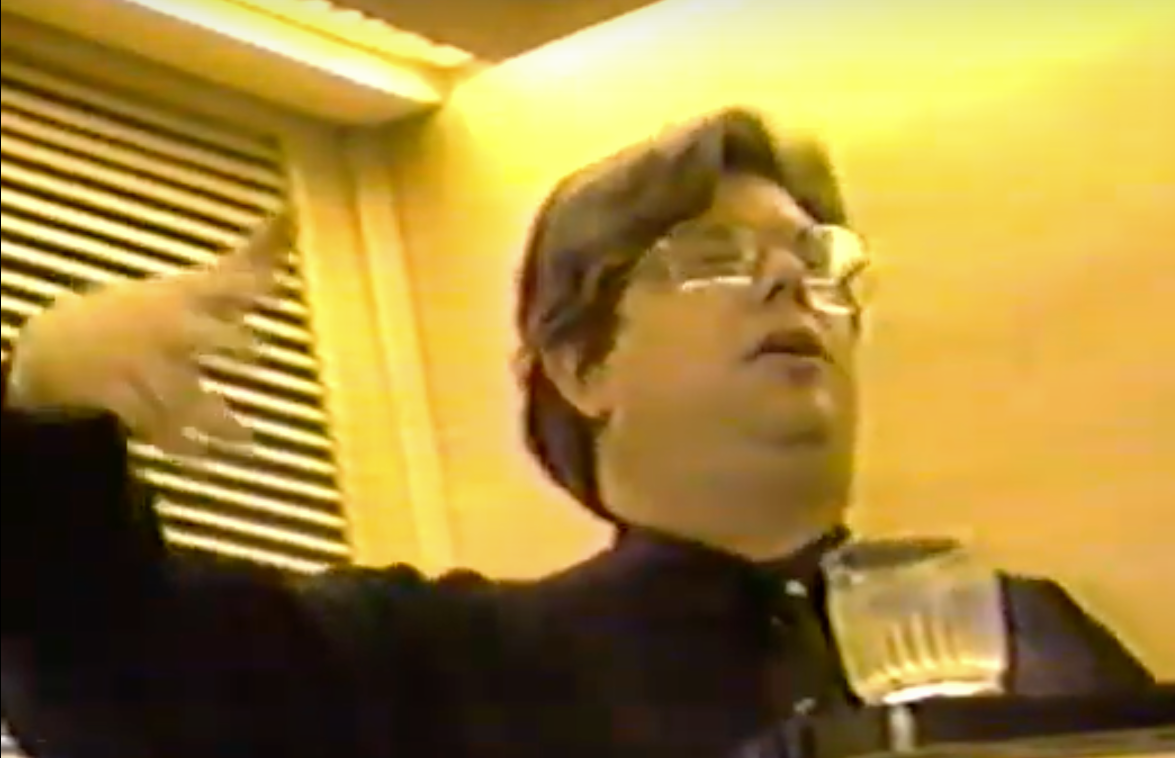
- Panel: "The VActor (TM) and the Human Factor" at SIGGRAPH 25 July 1994
in Orlando. Speakers: Alan Scrivener, Brad deGraf, Kristian Truelsen,
Art Doheny, Anne Hering, Richard Cray (posted to YouTube Mar 30, 2022)
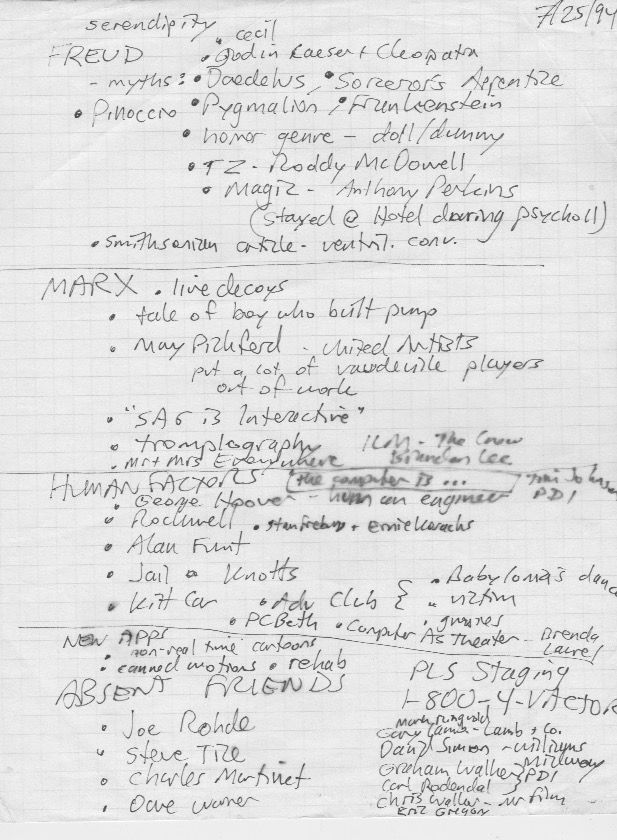 | 7/25/94 + serendipity + FREUD * Cecil * god in Caesar and Cleopatra * myths: - Daedalus - Sorcerer's Apprentice - Pinocchio - Pygmalion - Frankenstein * horror genre: - doll/dummy - TZ - Roddy McDowell - Magic - Anthony Perkins (stayed at hotel during Psycho II) * Smithsonian article - ventril. conv. ----------------------------------------- + MARX * live decoys * tale of boy who built pump * Mary Pickford - United Artists put a lot of vaudeville players out of work * "SAG Is Interactive" * tromplography * Mr & Mrs Everywhere * ILM - the Crow, Brandon Lee ----------------------------------------- + HUMAN FACTORS * "the computer is..." Tim Johnson PDI * George Hoover * Rockwell * Stan Freberg and Ernie Kovacks [Daws Butler ???] * jail @ Knotts [Sad-Eyed Joe] * Kitt Car * Adv Club: - Babylonia's dance - Babylonia's victim - Babylonia's g###s [???] * PCBeth [???] * Computer as Theater - Brenda Laurel ----------------------------------------- + NEW APPS * non-real time cartoons * canned motions * rehab + ABSENT FRIENDS * Joe Rohde [sp???] * Steve Tice * Charles Martinet * Dave Warner * PLS Staging * 1-800-4-VACTOR * Mark Ringwold * Gary Lamb - Lamb & Co. * David Simon - Williams Midway * Graham Walker, PDI * Carl Rodendal, PDI * Chris Wallar, Mr. Film * Eric Gregory |
 I was going to begin by mentioning something about how serendipity is the
researcher's best friend, and tie in something about the "live decoys" in the
lobby of the Peabody Hotel we were in, but I didn't know where I was going with
it so I skipped it.
I was going to begin by mentioning something about how serendipity is the
researcher's best friend, and tie in something about the "live decoys" in the
lobby of the Peabody Hotel we were in, but I didn't know where I was going with
it so I skipped it.
Hello, I'm Alan Scrivener and my background is real time computer graphics in aerospace and scientific visualization. Before I begin, I'd like to introduce my friend Sess-sill. [I displayed a puppet of Cecil the Seasick Sea Serpent on my hand.]I was short on my allotted time so I didn't read my list of "Absent Friends" — people who inspired me and others in this research, some of whom I'd hoped to get for the panel:[SESS-SILL:] I am I real? Can anybody tell me if I am real? [CRICKETS] Well drat, I was hoping someone would answer him, "No, you're not," so he could say, "Then why are you talking to me?" Moving on, as I ponder the issues around this new Virtual Actor technology, what we are calling "performance cartoons," "real time animation" and Simgraphics Engineering has trademarked as "VActor" techniques, I'm reminded of the works of two luminaries of the 20th Century, Freud and Marx. [I think I heard panelist Anne Hering snort in surprised amusement.] I think of them as important thinkers who mostly asked the right questions and mostly got the wrong answers. Doctor Freud discover the unconscious mind, and its spooky labyrinths. Virtual Actors, like puppets and dolls before them, engage our unconscious minds in eerie ways sometimes. I recall the play "Caesar and Cleopatra" by George Bernard Shaw, which begins with a prologue with a floating face of the Egyptian god Ra who speaks to the audience and ends up sneering at them because although they are real, they are mortal, and being mythical, he is immortal. In mythology, legend and literature we encounter the man-made being Golem, the tale of the Sorcerer's Apprentice bringing brooms to life, the story of Pinocchio, the wooden puppet who became a boy and a son, Pygmalion who makes his dream woman, and Doctor Frankenstein who makes his monster. The doll or puppet come to life appears in horror, including the old 1963 Twilight Zone episode "Living Doll" starring Telly Savalas, and the recent movie Magic starring Anthony Perkins. I think of Marx because he first mapped out the struggle between labor and capital, a struggle which is amplified by this new technology. There is a parable of s boy who is hired by a man to carry water in buckets from a stream to a water barrel. Instead he built a water wheel and a pump to transport the water without human labor. This parable is like an inkblot test. What should happen next? The man fires the boy? The man continues to pay the boy as long as the barrel gets filled? The man hires the boy at a higher salary to build other machines? The man and boy start a machine company together? This is where we see the interests of labor and capital collide in a simple case. I've read the silent film actress Mary Pickford received the most fan mail per capita of any celebrity ever. She and D. W. Griffith, Charlie Chaplin, and Douglas Fairbanks formed United Artists to get out from under the studio system and gain more control and money. But this newfangled motion picture medium put a lot of vaudeville players out of work. On the SIGGRAPH show floor I saw the Screen Actors Guild booth. They are trying to unionize digital work. I got this button that says "SAG Is Interactive." I was reminded that overall the shift from practical effects to CGI is also a shift from union to non-union special effects workers and companies. There has been a recent controversy when Industrial Light and Magic (ILM) finished the movie The Crow after star Brandon Lee died, using computer software. Some people are getting nervous. In a science fiction novel I love, "Stand On Zanzibar" by John Brunner, written in 1968 and describing the year 2010, there are TV characters called Mr. & Mrs. Everywhere, who look... [Bein videotape transcript] ...just like you! That there would be a little box on your set that pastes your face onto some other body that's running around on the screen. And you would get to watch yourself on TV, spouting political opinions and brand preferences; it could actually influence the way you live. I of course also want to talk about human factors component of this technology. I was recently at a talk by Tim Johnson of PDI and he said the two first rules of computer animation are the computer is your worst enemy and the computer is your best friend. That struggle, the fact that both of those are there, is at the heart of dealing with this technology. I believe it was a Navy chief named George Hoover who coined the word Human Engineer. He was doing cockpit designs and he wanted a psychologist. They wouldn't hire him one, they would only hire engineers, so he said, "I want a Human Engineer." I know that when I first got involved with human animation at Rockwell (Greg was there), we were doing animations of astronauts performing tasks, and we actually had a couple of human factors engineers on staff who helping us figure out things, like for a 5th to 95 percentile human, which was what NASA said the space station should be able to deal with, how short or long are the arms or the joints, and between the hip and the knee and so on; we had a program which would let us pick a percentile, like 47, and would generate a model of a person. They also did verification of our reach; they would have us reach back 180 degrees and grab something and things along those lines. But things really shifted when we got to the interactive world. I think the only pioneer I can recall in this area is Allen Funt, who did an awful lot of stuff with talking mailboxes and various pranks where he would sit there with a microphone and he was watching a television monitor, and just with his voice would try to get people to buy into this fantasy that the mailbox was alive and wanted a friend. There's also a really nice little low tech attraction at Knott's Berry Farm where children walk up to a jail, and there's a stuffed dummy sitting in the jail with a speaker inside it and it talks. Children walk up to this dummy and it calls them by name, and they're amazed: "How did it know my name?" There's this Knott's Berry Farm employee down at the other end of the street that's watching for when kids tear away from their parents to go talk to the dummy and comes up to the parents and asks them, "What's your kids name?", writes it down; they pass that note in to the person who's operating the dummy voice. Real low tech, real impressive for the kids. Whoever does that job must know an awful lot about the kinds of things Allen Funt did, which is how you get people engaged when you have a very low bandwidth channel. More recently there's been the Kitt car at Universal Studios; I don't know if it's out here in Florida but it's definitely in California. I understand that Christian actually operated a Kitt car; maybe he'll share with us some of the amazing things he learned from that. Of course I packed this panel with people from the Adventurer's Club because when I first visited there a few years ago I realized that this was a great training ground for people to operate vactor systems. They don't actually have digitally animated characters, but they have remotely operated puppets and they have to look at the crowd on a television monitor; in other words they have a pretty low bandwidth channel and they're still having to engage people. There's a particular event that often goes on in which stone mask called Babylonia, which is only a head, no body, picks a man out of the crowd, and she gets him to do a kind of a little dance for everyone. She typically picks a really macho guy, too; the kind of a guy who would not be predisposed to do a little dance for people. She's somehow got to bully or badger, flirt or cajole him into doing this with just a voice, some mechanical eyes, and a mechanical mouth. Anne has had experience in doing that five nights a week for years, so we're hoping we can hear about the kind of things that are involved with that. Lastly (this is a real lastly), I want to talk about new applications for this technology. When the first vactor systems ("Trademark") were put together, the expectation was that the designers and builders would sell them. They would sell them to studios that were going to do cartoons, they would sell them to people who put on trade shows. What they found was that they're hard to sell. The buyers are very nervous; they don't want to jump into a new technology without testing the waters; but there was great interest in renting the equipment, or just renting studio time to bring in a personality and hook them up to one of these systems, and then record their little trip, and they'd get some visual feedback in the form of a low-res cartoon image, and they'd take a tape away, and later they could reanimate that same image using ray tracing or other high-resolution computation intensive techniques, and produce a much better cartoon from the same data. Something else that's happened is there's actually been a company set up to sell canned motion data; the assumption being that there are some low budget cartoonists out there who don't want to take their own personality and digitize it, they just want some jumping, arm waving or some motion, and they'll just buy it off the rack. Thirdly, there's been some really incredible experiments done using this technology for pediatric psychiatry and dealing with children who are in medical rehabilitation. At Loma Linda University Medical Center they took a vactor system out, they did a bunch of different things but the most impressive thing to me was they went through cancer ward where kids were bedridden, were being treated for cancer and they would put a character like Mario up on the television screen in the hospital room and the kid could talk on the phone to that character and interact with them. They found this had a tremendous effect on the psychological state of the children. They were incredibly elated by this experience, it was like a high point of their lives, practically, and this has very important therapeutic impact, because something else they've studied at Loma Linda is the impact of your emotional state on your immune system. They've found very definite correlations that happiness, glee, mirthful laughter all strengthen the immune system. So we need to be doing things to get people into a good mood when they're healing. So that's about all I have to say; I wonder if I've used more than my allotted 10 minutes... no, I think I did just about right. I wanted to mention that if you actually want to rent a vactor system there's a company called PLS Staging, you can call 1-800-4VACTOR and rent one for your event.
-
* Joe Rhode (Imagineer for the Adventurer's Club)
* Steve Tice (founder of Simgraphics, pioneers of performance cartoons)
* Dave Warner (pioneer of performance cartoons in pediatric rehab)
* Charles Martinet
* Mark Ringwold
* Eric Gregory
* Gary Lamb, Lamb & Co.
* David Simon, Williams Midway
* Graham Walker, PDI
* Carl Rodendal, PDI
* Chris Wallar, Mr. Film
* PLS Staging