copyright © 2007 Paolo B. DePetrillo, MD
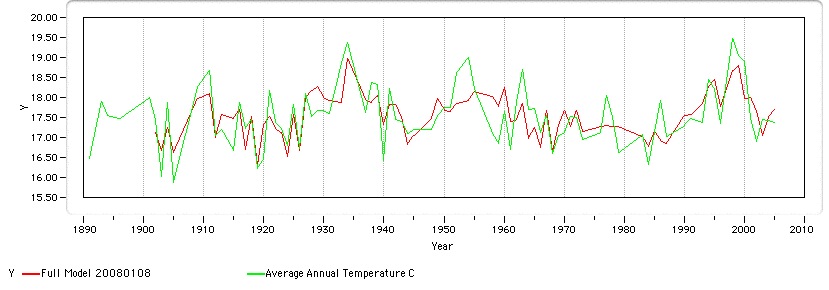
Full Model
Click here for model parameters in a new page.
As you can see, this is the new and improved version of the model. I will describe the methods I used to determine the significant periods for these temperature cycles on another page since it's a bit more complex than the previous iteration which can be found archived here. However, I urge you to look here because there is some information on the mechanics of modeling that you might find helpful in understanding these pages. Once the station data gets updated for 2006 and 2007, we can use the model to predict future temperatures.
All of these periods are derived from a time-consuming but fun method whereby several different techniques were used to pull significant frequencies from the temperature time series. All of the frequencies met very stringent probability criteria for inclusion. Verification by three or more methods, and a > 0.95 or more probability of not being "spurious." While it took a lot longer, the model runs were much happier when these frequencies were used to seed the initial parameter search. It is sort of like pointing the hounds in the general direction of the fox rather than letting them run all over the field looking for a good lead.
The current model has half of the SSE of the previous one, at the cost of a bunch of parameters.
Conclusions
For Haskell, TX, neither the raw or extrapolated data set robustly support an increase in temperature over time.
In Haskell, TX, since 1890, at least three factors may influence the mean annual temperature.
A cycle with a period of about 64 years, ?PDO
A cycle with a period of about 4 years ?ENSO
A cycle with a period of about 11 years (sunspot cycle) and the effect of average sunspot number .
The best fit is obtained when the number of sunpsots value is taken into account as the area under the sunspot - time curve lagged up to 5 years. This makes sense as we would expect a large system like climate to require some time before experiencing the effects of the solar cycle.
Discussion
You need to always compare your models to the simplest case, otherwise you run the risk of adding parameters that are not justified by the better fit. I want to emphasize this point because you will come across "least-mean square" linear fits that seem to "fit" data well in the form Y = P1X + P2 where P1 is the slope and P2 is the intercept. Unless these two parameter models are compared to the simplest case, namely the one parameter "mean fit" model of the form Y = P2, any conclusion about "goodness of fit" is suspect.
The linear model using extrapolated data suggests there appears to be a little bit of a warming trend in Haskell, TX since 1889. About 0.005 +/- 0.002 degrees per year. However, if the same models are run using raw data, there is no statistical support for choosing the more complex model, and the warming trend disappears. The average yearly temperature in Haskell, TX may be 17.53 C +/- 0.08 and a warming trend may not be evident. Take your pick. I do not like using extrapolated data, nor doing linear fit models without comparing the linear fit to the simplest case. So your mileage may vary.
I say "may not be" because just like we accept a confidence level of 5% to reject the null hypothesis that there is no warming, meaning that 5% of the time we reject the null hypothesis even though it is true, we also need have a confidence level for accepting the null hypothesis, though it is rarely mentioned in reports of many studies. In this instance, stating "there is no warming" without also giving a confidence level for this statement is just plain stupid!.]
Much of the biological scientific literature has been polluted by this unclear thought, with statements of the form " There is no difference in the means between group A and Group B" without giving a confidence level for the statement. It is just as illogical as stating "There is a difference in the means between group A and Group B" without giving a confidence level. The confidence level for accepting the null hypothesis is "beta." I'm not going into the specifics yet, but my confidence level for accepting the null hypothesis is also 5%, meaning that 5% of the time I will accept it even though it is not true. In the case of effects of carbon dioxide on warming, I cannot accept the null hypothesis that there is no effect, since the "beta" is > 5%. It is still an open question which, for data I have analyzed, can only be answered by more data. More data, better conclusions. Isn't that always the case?
In the past century, we have experienced 2 x 1/2 cycles of PDO " warm," and a little more than one 1/2 cycle of PDO "cold." Look at the graph above. It trends cold from 1890 to 1900 but part of the cycle is not present. It again trends cold from 1948 to around 1979. But there are two complete warm trend cycles - one from 1900 to 1938 and one from 1978 to present. This skews the data towards a warm result over this period of time if this is not accounted by the model. I wish we had a couple of centuries worth of CO2 and local temperature data, since this would help refine the model by including a number of these cycles. As time permits, I will perform the same analysis for several locations in the United States and present the results in these pages.
Data is from 1890 to present. This limits the conclusions to this time period, namely the magnitude of many of the parameters.
Data is incomplete, since no extrapolated points were used when data points were missing. This may have biased the results.
I have not ruled out an effect of carbon dioxide on temperature. In stat speak, I do not have the power to rule it out at some reasonable confidence level. And I don't reach a reasonable level of significance to rule it in. Hence, the question is not answered. Like everything else, it would have been nice to have a lot more data.
There are obviously other factors influencing the temperature, and of course it is possible that carbon dioxide may itself influence the length or phase of some of the cycles. That is an empiric question which needs expert study.
Some time I'm going to get to Haskell, TX. And for all the work done by dedicated folks at GISS and NASA, a profound sense of awe and thanks.
I will also pretty up this page at some point.
Next page