copyright © 2007 Paolo B. DePetrillo, MD
Updated 2008.01.23
I included the graph of the temperature time series from the station since it looks a bit different from the others. Here is the linear fit, which is much much better than the mean fit, which has an SSE of 43.50. Remember, the lower the SSE, the better the model for these data.
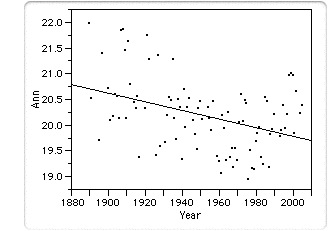
T = -0.008 [0.002] x Year + 36 [4]
SSE = 36.72 DFE 92 MSE 0.40 RMSE 0.63
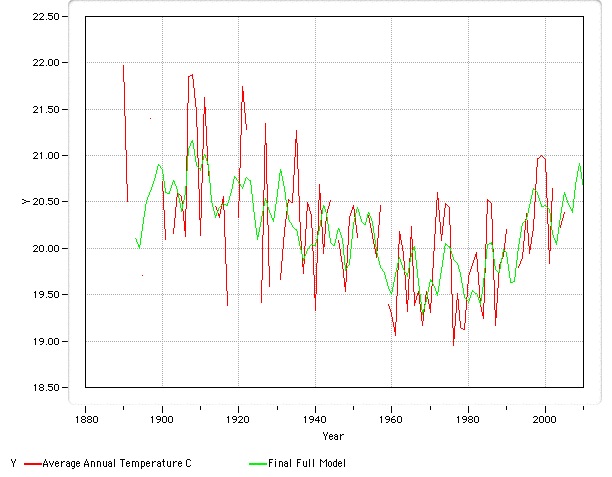
That's right, according to these data, the temperature in Grand Coteau, LA has been falling over the past hundred years, if you believe the linear fit. Whether it's going up or down for these kinds of data, I'm not a big fan of linear fits. And here is the full model.
Click here for model parameters
Comparing to linear fit
Compare models with the corrected Akaike's Information Criteria
Linear Fit Full Model
Sum-of-squares 36.72 23.45
Number of data points 92 92
Number of parameters 2 10
Akaike's Information Criteria (corrected, AICc) -78.23 -100.46
Probability model is correct 0.00% 100.00%
Difference in AICc 22.23
Information ratio 67178.79
Full Model has a lower AICc than Linear Fit so is more likely to be the correct model.
It is 67178.8 times more likely to be correct than Linear Fit.
Compare models with F test
Model SS DF
Linear Fit (null) 36.72 90
Full Model (alternative) 23.45 82
Difference 13.27 8
Percentage Difference 56.59% 9.76%
Ratio (F) 5.80
P value <0.0001
If Linear Fit (the null hypothesis) were true, there would be a 0.00% chance of obtaining results that fit Full Model (the alternative hypothesis) so well.
Since the P value is less than the traditional significance level of 5%, you can conclude that the data fit significantly better to Full Model than to Linear Fit.
Thanks to the nice folks at GraphPad
Conclusions
In Grand Coteau, LA, since 1891, there appear to be cycles corresponding to known climactic patterns. Climate scientists are welcome to speculate about the others.
PDO of around 56 years
ENSO-like cycle with a period of about 4 years
Sunspot cycle of about 11.6 years
According to a linear fit model, we can conclude that since 1891 there may be a cooling trend of 0.008 +/- 0.002 +/- SE Celsius degrees/ Year. However, the caveat is that this model does not fit the data as well as the Full Model containing cyclical terms. I do not believe there is a cooling trend. Why don't I believe there is a cooling trend? Because this type of complex time series with multiple cycles, when fitted to a linear model, makes the conclusions suspect especially when the length of time of the series is relatively short compared to the cycle lengths. If you believe the AIC, there is pretty much no chance that the linear model is correct relative to the full model.
Since this station is close to a large body of water, maybe there are local influences on temperature due to oceanic current cycles.
Thanks to the folks at the station, there was only a small amount of missing data points for annual average temperature. I have not used extrapolated data points in the analysis.
Limitations
Data is from 1891 to present. This limits the conclusions to this time period, namely the magnitude of many of the parameters.
I have not ruled out an effect of carbon dioxide on temperature. In stat speak, I do not have the power to rule it out at some reasonable confidence level. And I don't reach a reasonable level of significance to rule it in. Hence, the question is not answered. Like everything else, it would have been nice to have a lot more data.
There are obviously other factors influencing the temperature, and of course it is possible that carbon dioxide may itself influence the length of some of the cycles. That is an empiric question which needs expert study.
Next page