copyright © 2007 Paolo B. DePetrillo, MD
As you can see, there is some data missing from this station. Some of these points were extrapolated, and I have left them out of the analysis. When I looked at the raw data, I also had to eliminate a number of points that had been extrapolated. I don't know how to extrapolate points from a non-stationary time series and I don't want to learn right now! I also prefer looking at the raw data.
This is a good lesson in what happens when whole chunks of data are missing from a relatively complex time series.
Here is the linear fit, which is much much better than the mean fit. The best model for a linear fit did not have an intercept.
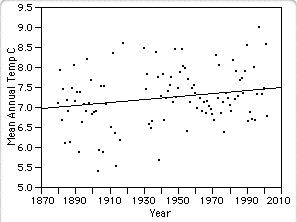
T = 0.00373 [0.00003] x Year
SSE = 49.48 DFE 104 MSE 0.48 RMSE 0.69
In building the model, I discovered that neither the longer cycle "PDO" term nor the shorter "ENSO" term met criteria for entry into the model. The sunspot term initially appeared to enter into the model, but it failed the "add more parameters you better have a lot better fit" test. I keep stressing this concept because like I said, give a modeler enough parameters and they will fit a random number sequence for you.
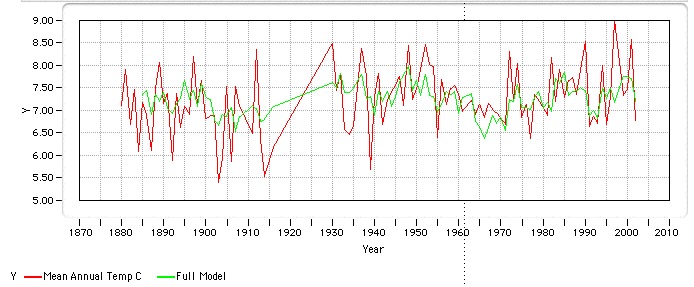
T = P(1+3i)) x Cosine {(Year+ P(2+3i)) *3.1415) / P(3+3i); i=0 to 2; + P25 x {Cosine {(Year +P26) *3.1415) / P27}
* (LogSun,lag 0 years + 2*LogSun, lag 1 years + 2*LogSun, lag 2 years +2*LogSun, lag 3 years+2*LogSun, lag 4 years + LogSun, lag 5 years )
+ P10
SSE = 30.23 DFE 74 MSE 0.41 RMSE 0.64
Click here for model parameters
Comparing to linear fit
Compare models with the corrected Akaike's Information Criteria
Linear fit Sunspot Only Model
Sum-of-squares 49.48 37.29
Number of data points 100 100
Number of parameters 1 10
Akaike's Information Criteria (corrected, AICc) -66.24 -73.64
Probability model is correct 2.40% 97.60%
Difference in AICc 7.41
Information ratio 40.61
Full Model has a lower AICc than Linear Model so is more likely to be the correct model.
It is 40.6 times more likely to be correct than Linear Model.
Compare models with F test
Model SS DF
Linear fit (null) 49.48 99
Sunspot Only Model (alternative) 37.29 90
Difference 12.19 9
Percentage Difference 32.69% 10.00%
Ratio (F) 3.27
P value 0.0017
If Linear Model (the null hypothesis) were true, there would be a 0.17% chance of obtaining results that fit Full Model (the alternative hypothesis) so well.
Since the P value is less than the traditional significance level of 5%, you can conclude that the data fit significantly better to Full Model than to Linear Model.
Thanks to the nice folks at GraphPad
Conclusions
Only three main sets of parameters could be estimated, because of missing data. The predictive value is limited, but the similarity in the periods of the longest cycles with other sets of data suggest similar cyclical influences on yearly average temeprature, including the solar cycle.
Thanks to the folks at the station, who were probably trying to stay warm during the Great Depression.
Limitations
This time series had many missing points, many chunked together spanning the Great Depression years. Sure, it's tempting to extrapolate the missing points, but given there are literally hundreds of other rural stations, it is not worth the effort. I am leaving this in the set as a reminder that complete data sets are worth their weight in gold.
Next page